Statistics
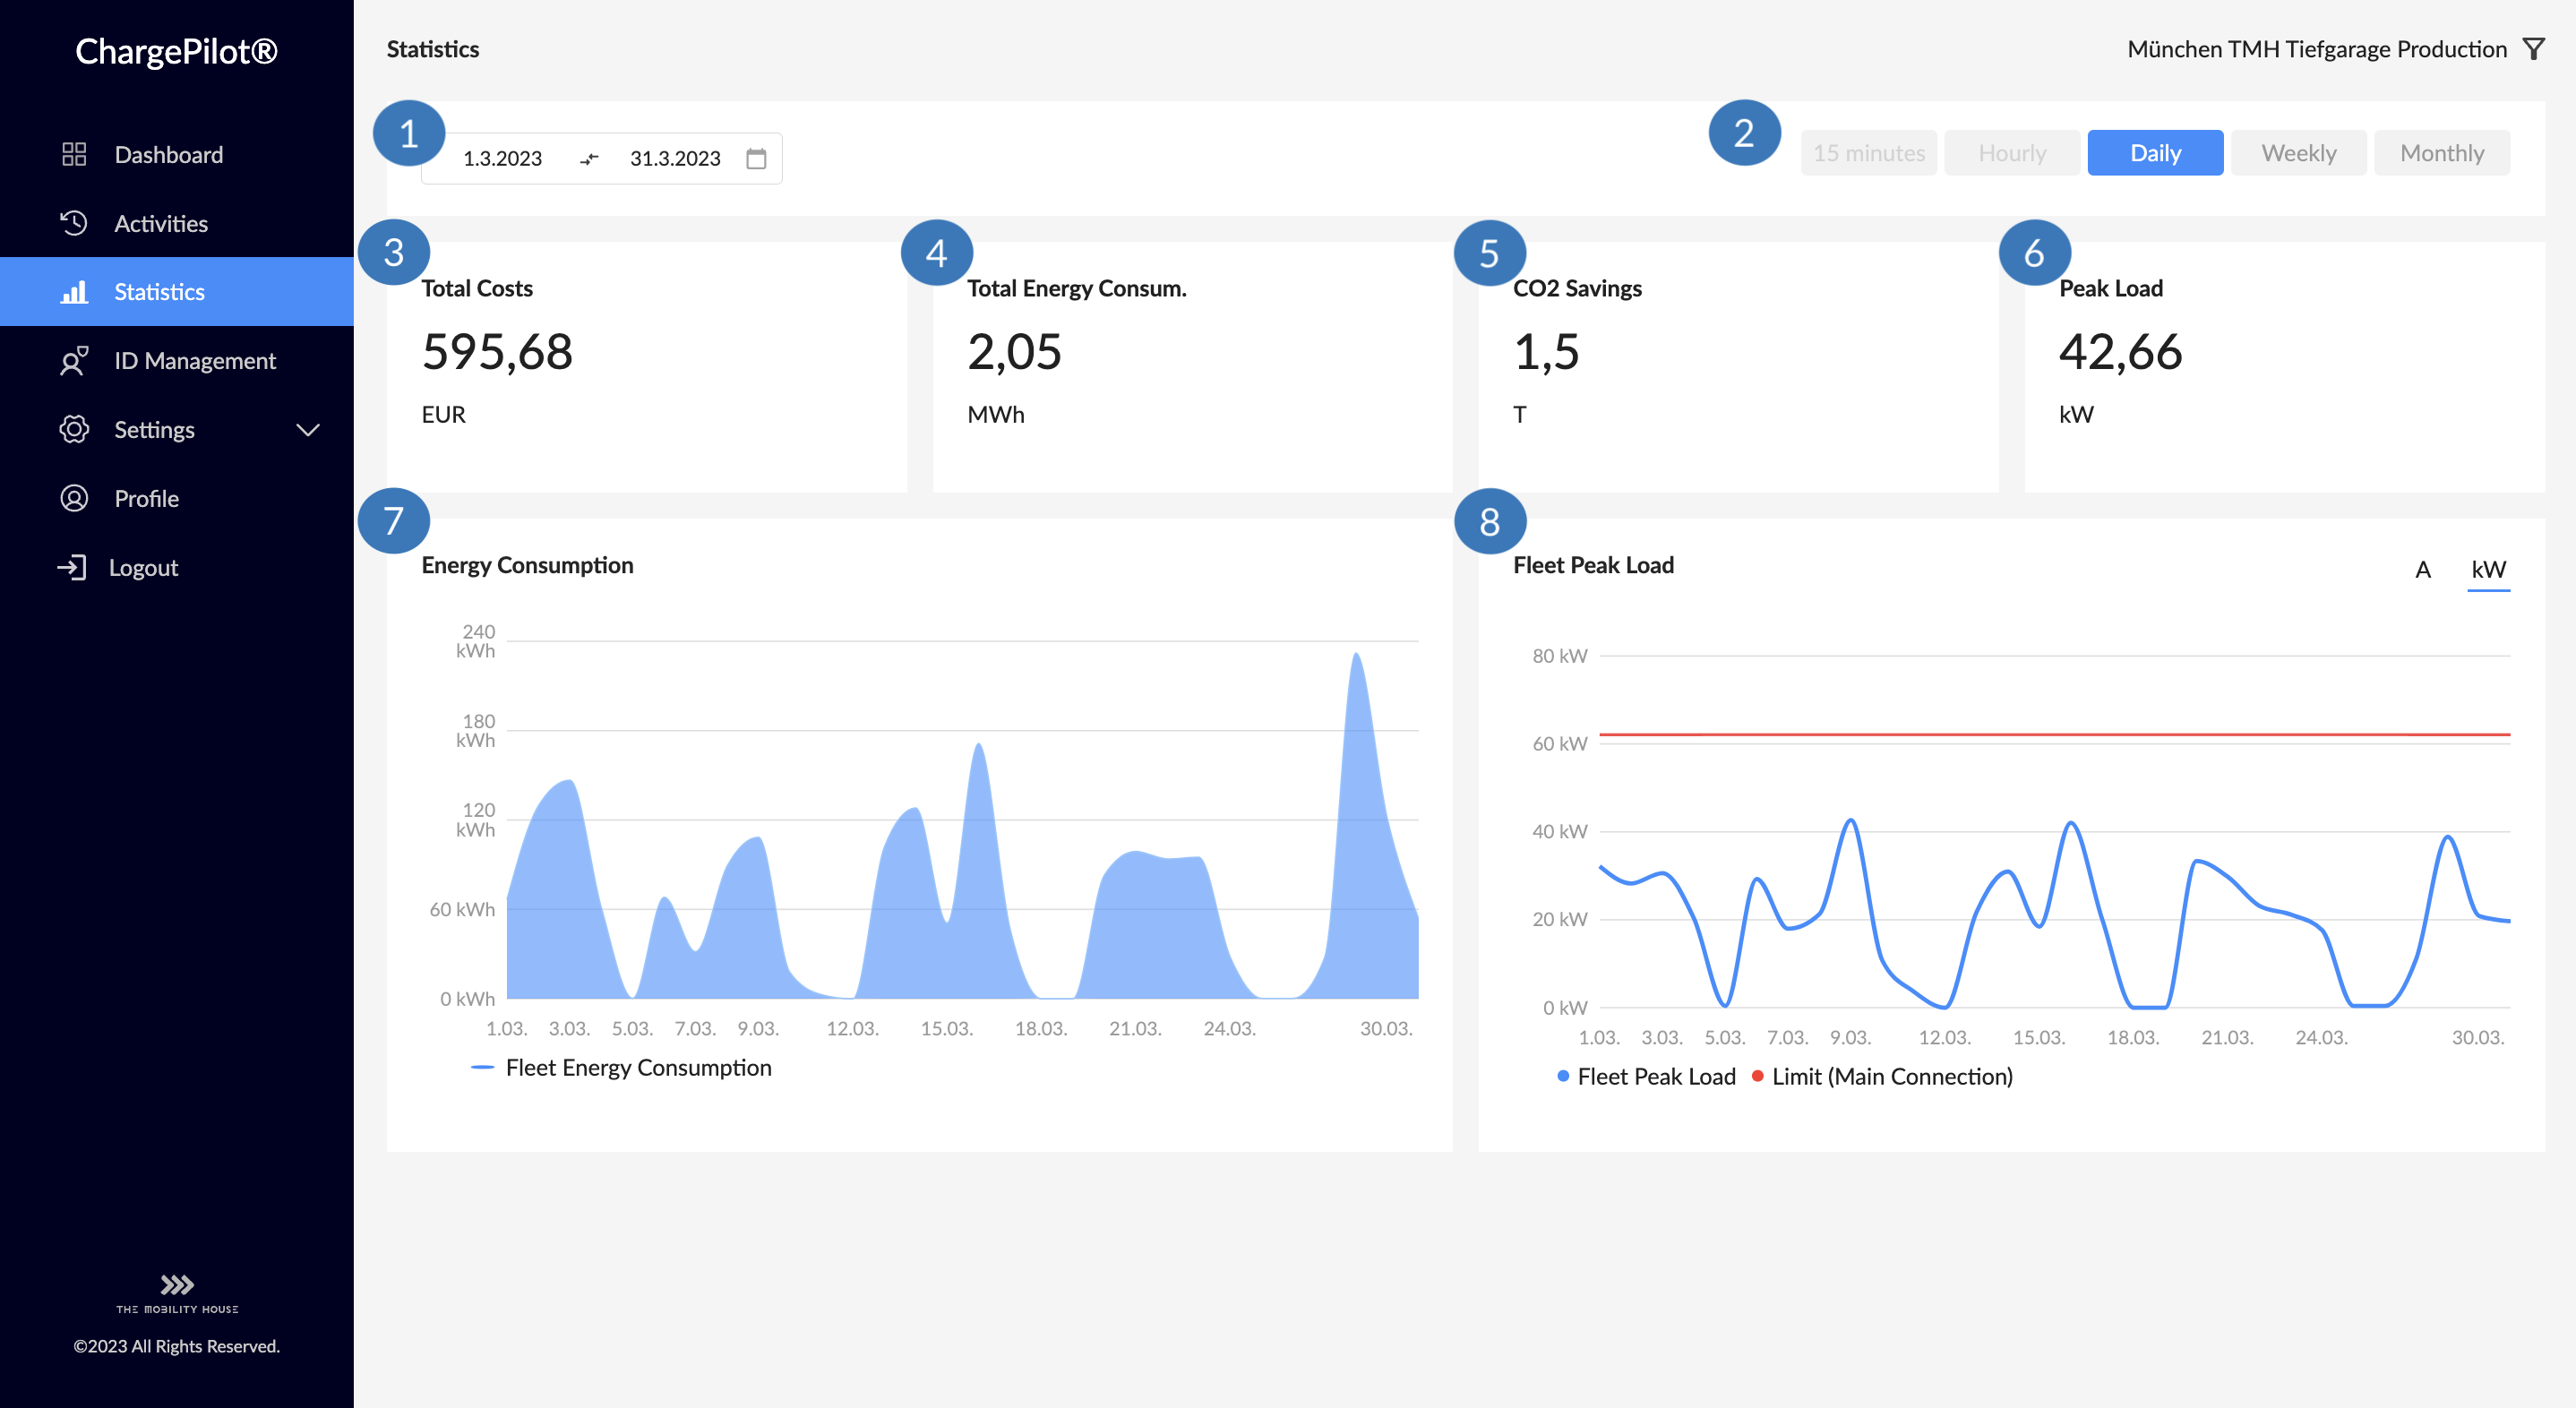
1️⃣ Selection of the time period on a daily or hourly basis
2️⃣ Selection of the view of the visualisations within the selected period on a quarter-hourly, hourly, daily, weekly or monthly basis.
3️⃣ Overview of the total costs in the selected period; based on the set tariff
4️⃣ Overview of total energy consumption in the selected period
5️⃣ Overview of CO2 savings in the selected period
6️⃣ Maximum peak load in the selected period
7️⃣ Visualization of the energy consumption in kWh in the selected period and in selected view
8️⃣ Visualization of the maximum peak load in kW or A in the selected period and in selected view → Display only possible when a site is selected